Applications, ranging from e-commerce platforms to business software, drive operations, revenue, and customer pleasure for businesses. Ensuring excellent application performance is critical to maintaining a competitive advantage. Here is where application monitoring tools come in helpful.
Application monitoring tools provide essential insights into application health, performance, and user experience, allowing businesses to identify and resolve issues in advance. This article will show the top 15 application monitoring tools that may help businesses make data-driven decisions and provide excellent user experiences.
What Are Application Monitoring Tools?
Application monitoring tools function like gauges, sensors, and alarms for web applications and mobile apps. Such tools deliver real-time application performance updates similar to how we track complex equipment operations for smooth functionality. These tools check the measurement of response time, throughput, and error rate.
By continuously monitoring these elements, APM technologies help spot issues before they become severe outages or slowdowns that could negatively affect user experience. These solutions act as proactive guardians, ensuring optimal app performance, seamless user experiences, and the success of digital endeavors like e-commerce and online consumer involvement.
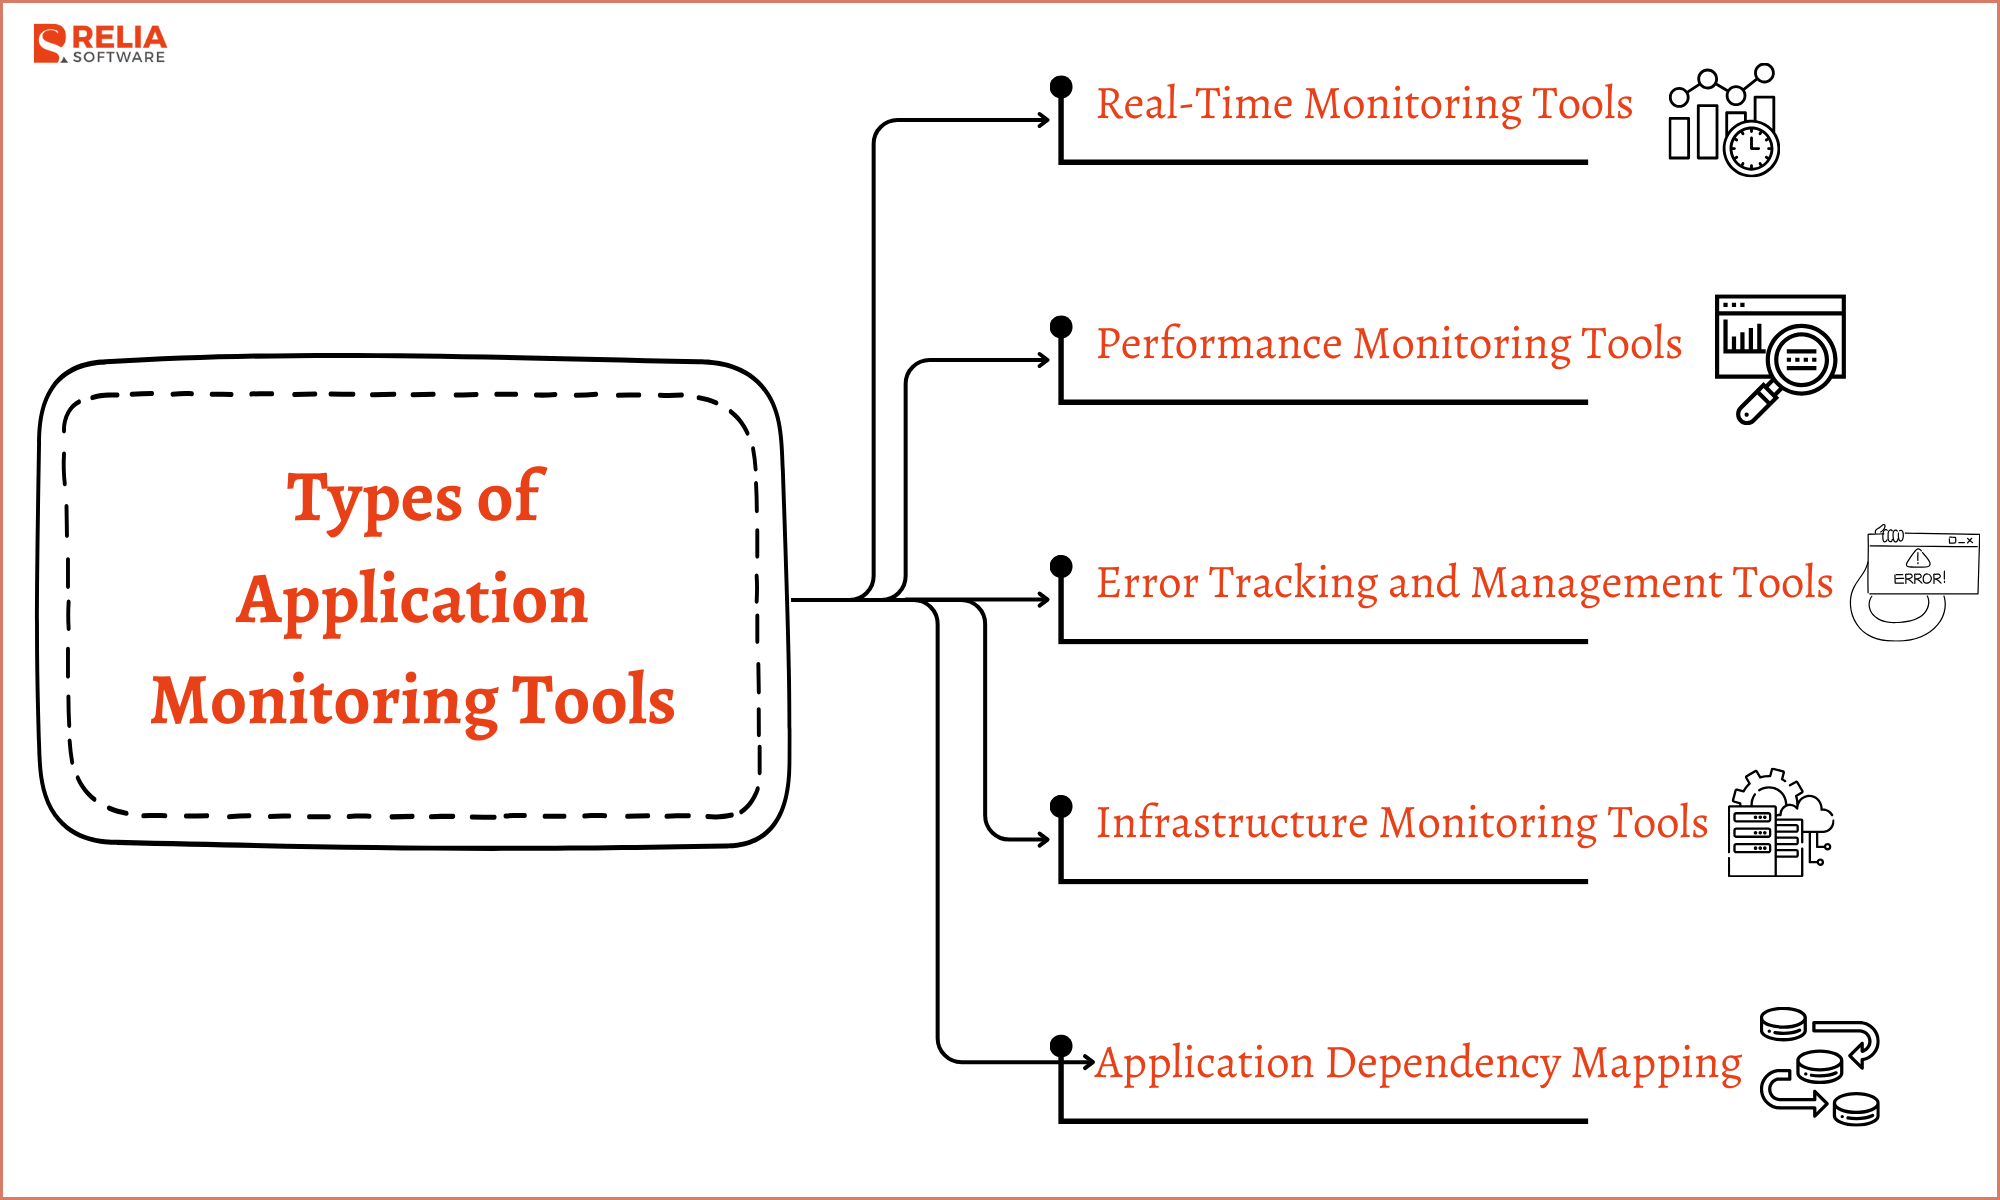
5 typical types of application monitoring tools are:
- Real-Time Monitoring Tools: This provides a live view of key indications in order to enable solutions and fixes before problems escalate.
- Performance Monitoring Tools: These monitor throughput, resource utilization, and response times to find out bottlenecks, ensure continuity in application, and optimization of performance.
- Error Tracking and Management Tools: These tools reveal the type of error, its location, and frequency to enable quick fixes for a seamless user experience.
- Infrastructure Monitoring Tools: These are fundamental for monitoring crucial components of the infrastructure and also provide health and functionality data that help to avert cascading issues.
- Application Dependency Mapping: These are tools that visualize component dependencies, which are essential in troubleshooting and understanding the changes in the application ecosystem.
15 Best Application Monitoring Tools in 2025
Tools | Types | Best for | Pricing |
Datadog | Performance Monitoring Tool | Cloud-native, microservices, and containerized applications | $15/user/month (14-day free trial) |
Dynatrace | Performance Monitoring Tool | Enterprise-scale, AI-driven monitoring for distributed systems | $21/user/month (15-day free trial) |
New Relic | Performance Monitoring Tool | Web applications, mobile apps, and cloud-based services | $6/user/month |
AppDynamics | Performance Monitoring Tool | Enterprise web and mobile applications | $2,970/year (11-25 units) |
IBM Instana | Performance Monitoring Tool | Kubernetes, hybrid cloud, and microservices-based apps | Non-public (based on the number of monitored hosts) |
SolarWinds Server and Application Monitor (SAM) | Infrastructure Monitoring Tool | On-premise enterprise applications and IT infrastructure | $1,813/year (30-day free trial) |
Sumo Logic | Error Tracking and Management Tool | Cloud applications with real-time log analytics | $2.05/user/month (A free tier with limited features) |
Site24x7 | Infrastructure Monitoring Tool | SaaS applications, websites, and infrastructure monitoring | $9/user/month (30-day free trial) |
Amazon CloudWatch | Infrastructure Monitoring Tool | AWS-based applications and infrastructure monitoring | Free use available with basic features |
Google Cloud Operation | Performance Monitoring Tool | Google Cloud Platform applications and microservices | Free use available |
LogRocket | Error Tracking and Management Tool | Single-page applications (SPAs) and web frontend performance | Free plan with basic features |
Raygun | Error Tracking and Management Tool | Web and mobile applications with real-time crash reporting | Non-public (based on request from the vendor) |
Honeycomb | Real-Time Monitoring Tool | Event-driven, distributed microservices applications | Non-public (based on request from the vendor) |
Grafana | Real-Time Monitoring Tool | Custom dashboards for metrics visualization | Free and open-source |
Zabbix | Infrastructure Monitoring Tool | On-premise infrastructure and enterprise applications | Free and open-source |
Datadog
Datadog operates as a cloud-observability solution that delivers application monitoring, security, analytics across applications, infrastructure, and logs. The platform works well with cloud-native, microservice networks, and containerized application systems, thus this framework is suitable for DevOps.
Key Features
- Real-time application, infrastructure, and log monitoring.
- Distributed tracing for APM.
- Infrastructure monitoring using metrics and visuals.
- Analytics and log management.
- Network performance monitoring.
- Security monitoring and anomaly detection.
- Alerts and notifications.
- Custom dashboards and views.
Pros
- Comprehensive monitoring tool with many capabilities.
- Strong tool and technology integration.
- User-friendly UI and visualization.
- Robust alert and notification system.
- Active community, and rich documentation.
Cons
- Expensive for large data volumes.
- Performance issues with large datasets.
Dynatrace
Dynatrace is an AI-driven observability and application performance monitoring platform for large-scale enterprise applications. Probably, this tool provides the key features for real-time monitoring, auto-root cause analysis, and AI-driven insights to optimize application performance both in hybrid and multi-cloud environments.
Key Features:
- Diagnoses performance problems automatically by using artificial intelligence (AI).
- Monitors full-stack application, infrastructure, and user experience.
- Displays real-time performance metrics.
- Presents anomaly identification.
- Monitors user experience and performance.
- Cloud application and infrastructure monitoring supported.
Pros
- Strong AI-driven performance analysis.
- Complete full-stack monitoring.
- High user experience focus.
- Automatic root cause analysis.
- Integrations with many tools.
Cons
- Complex setup and configuration.
- High cost for large-scale deployments.
- Reports of customer support issues.
New Relic
New Relic serves as a complete observability platform showing real-time performance data about applications, log information, and infrastructure status. New Relic's powerful features make it an optimal solution for web applications and mobile apps because users obtain comprehensive insights into both code practices and user interface interactions.
Key Features
- Check application performance, find bottlenecks, and optimize code.
- Monitor server, network, and cloud health.
- Assess website and app performance from user viewpoints.
- Retrieve and analyze logs from various sources.
- Test application availability and performance from multiple locations.
- Create performance-based alerts and notifications.
- Monitor critical KPIs with personalized visualizations.
Pros
- All-encompassing features.
- High priority on application performance.
- Price flexibility.
- Large user base, and rich documentation.
- Integration with many technologies.
Cons
- High price for large deployments.
- Difficulties in some platform performance.
AppDynamics
AppDynamics gives users the ability to track business transactions while performing deep application performance monitoring. This solution enables organizations to enhance application performance efficiency by finding system failures while improving user experience across complicated IT systems.
Key Features
- Check application performance, find bottlenecks, and optimize code.
- Monitor business transactions and performance.
- Show application performance metrics in real-time.
- Check infrastructure health and performance.
- Fix errors and exceptions.
- Locate user performance issues by tracking interactions.
- Monitor cloud apps and infrastructure.
Pros
- High priority on application performance and business effect.
- Ability to monitor in real-time.
- Thorough performance analysis and troubleshooting.
- Multiple technology and framework integration.
- Strong help for customers.
Cons
- High large-scale deployment cost.
- Several interface issues.
IBM Instana
IBM Instana is a real-time observability solution for dynamic and distributed applications. It provides automated monitoring from cloud-native, hybrid, and on-premises infrastructures; as well as AI-driven insights for Kubernetes, microservices, and DevOps teams.
Key Features
- Explores application components and dependencies automatically.
- Shows application performance metrics in real-time.
- Identifies distributed system performance bottlenecks by tracking requests.
- Simulates user behavior to find performance concerns.
- Tracks infrastructure health and performance.
- Detects anomalous behavior and concerns by AI.
- Helps diagnose performance issues.
Pros
- Automation of app discovery and mapping.
- Large emphasis on distributed tracing and microservices.
- Root cause analysis and AI anomaly detection.
- Deep IBM Cloud and IBM technology integration.
Cons
- More cost for large-scale deployments.
- Regular interface issues.
- Limited third-party integrations compared to other APM tools.
SolarWinds Server and Application Monitor (SAM)
The SolarWinds SAM solution delivers a thorough monitoring system that enables businesses to monitor their server health, application performance, and their dependent elements. The system functions best for both on-premise solutions and hybrid cloud environments.
Key Features
- Track server health, resource use, and performance.
- Track application availability, response times, and performance.
- Visualize and comprehend complicated IT systems.
- Examine performance trends and bottlenecks.
- Set performance threshold alerts and notifications.
- Perform performance analysis using bespoke reports and dashboards.
Pros
- High emphasis on server and app performance monitoring.
- Complete on-premises feature set.
- Easy-to-use UI and reporting.
- Affordable price compared to other APM tools.
Cons
- Most focused on on-premises environments with limited cloud monitoring.
- Lack of advanced analytics and AI compared to other APM systems.
- Heavy load has caused tool performance issues for some users.
Sumo Logic
Sumo Logic is a cloud-native analytics platform that provides log management, security monitoring, and application performance insights. It is widely used for real-time analytics, troubleshooting, and security compliance in modern cloud applications.
Key Features
- Retrieve and analyze logs from various sources.
- Run real-time log analysis.
- Detect anomalies and recognize patterns via machine learning.
- Track application performance, bottlenecks, and issues.
- Use infrastructure logs to assess performance and health.
- Identify and address security threats.
Pros
- Effective log management and analytics.
- Capable of handling enormous data volumes.
- Integrating with many applications and services.
- Effective learnings from machine learning.
Cons
- Primary log management, with APM as a bonus.
- Difficult setup and configuration.
- More cost of large-scale deployments.
Site24x7
Site24x7 is an all-in-one cloud-based monitoring platform that covers websites, servers, applications, networks, and logs. It is ideal for SaaS businesses, DevOps teams, and IT administrators who need a unified monitoring solution.
Key Features
- Monitor website performance, uptime, and response time.
- Check your server’s health, resource use, and performance data.
- Observe network devices, bandwidth, and latency.
- Receive performance and outage alerts.
- Prepare detailed performance reports and analytics.
- Simulate user actions to measure website performance.
Pros
- Friendly UI and simple use.
- Complete website and infrastructure monitoring.
- Flexible pricing choices.
- Well-supported customer service.
Cons
- Fewer extensive application performance monitoring features than specialist APM tools.
- Poor error tracking and management compared to other tools.
- Large-scale scaling issues.
Amazon CloudWatch
Amazon CloudWatch exists as a monitoring solution providing observability services for AWS applications together with infrastructure elements. It plays a central role in AWS monitoring, as the system gathers data through logs, metrics, and events to deliver instant insight into cloud resources, performance, and security aspects.
Key Features
- Track AWS and custom application metrics.
- Gather and analyze AWS service and application logs.
- Set metric threshold alarms and automate actions.
- Visualize stats and logs with bespoke dashboards.
- Track and address system-wide occurrences.
Pros
- Integrating AWS services tightly.
- Scalable for huge data sets.
- Cost-effective for AWS resource monitoring.
- Strong analytics and visualization.
Cons
- Limited application performance monitoring, mostly infrastructure monitoring.
- Setup and configuration require technical expertise.
- Limited on-premises application and infrastructure support.
Google Cloud Operations
Google Cloud Operations is a unified monitoring, logging, and diagnostics tool for GCP applications. It provides good visibility into the running workload on the cloud for proactive troubleshooting and performance optimization.
Key Features
- Gather, analyze, and display GCP and custom application metrics.
- Retrieve, search, and analyze GCP service and application logs.
- Use distributed tracking to monitor how well an application is across all services.
- Detect, diagnose, and aggregate application faults automatically.
- Visualize stats and logs with bespoke dashboards.
- Set a metric threshold and condition alerts.
Pros
- Strong integration with Google Cloud Platform.
- Scalable for large-scale monitoring.
- Strong analytics and visualization.
- No-cost basic monitoring.
Cons
- Primarily focus on GCP resources, with limited support for on-premises or other cloud platforms.
- Rising prices due to heavy usage.
- Some interface and navigation issues.
LogRocket
LogRocket is a frontend monitoring and session replay tool that helps developers analyze user interactions, diagnose UI issues, and improve web application performance. It is especially useful for debugging single-page applications (SPAs).
Key Features
- Replay user sessions to find problems.
- Record and track JavaScript errors.
- Track performance indicators like page load times.
- Assess user behavior and pain spots.
- Monitor front-end performance and issues.
Pros
- Detail-oriented session replay for issue inquiry.
- Prioritise user experience and debugging.
- Integrate with popular development tools and frameworks.
Cons
- Focused on frontend issues, limited backend monitoring.
- Costly large-scale applications.
- Documented performance concerns with session replay in high-traffic areas.
Raygun
Raygun is an error and performance monitoring tool designed for web and mobile applications. It provides real-time crash reporting, user experience insights, and application performance tracking to help developers fix issues quickly.
Key Features
- Track mistakes and exceptions.
- Track response and load times for application performance.
- Observe end-user behavior.
- Diagnose app crashes.
- Monitor deployment effects on application performance.
Pros
- Prioritise mistake tracking and performance monitoring.
- Easily use platform interface and reports.
- Well integrate with common development tools and frameworks.
Cons
- Fewer infrastructure monitoring capabilities than other APM tools.
- Limited customizability and reporting possibilities.
Honeycomb
Honeycomb is an observability platform built for event-driven, distributed microservices architectures. It allows developers to explore, debug, and optimize performance in complex cloud-native applications.
Key Features
- Shows application and infrastructure performance together.
- Analyse distributed system request flow.
- Utilize custom metrics to understand application behavior.
- Identify issues rapidly using real-time data analysis.
Pros
- Concentration on observability and complicated systems.
- Flexible data model for rich context.
- Quick query performance for troubleshooting.
- Strong community and open-source contributions.
Cons
- More difficult to learn than other tools.
- Rising costs for large deployments.
- Minimal focus on infrastructure monitoring and other APM capabilities.
Grafana
As an open-source tool, Grafana helps users create visualizations of metrics from sources such as Prometheus Elasticsearch and InfluxDB. Grafana functions as a popular platform for designing tailored dashboards for tracking infrastructure and applications.
Key Features
- Customise dashboards and visuals.
- Combine monitoring tools with database data.
- Set data threshold alerts.
- Interact with info through dashboards.
- Have a vibrant community with many plugins and integrations.
Pros
- Fully customizable and adaptable.
- Open-source option.
- Solid community and ecosystem.
- Great data visualization.
- Available portal for multiple monitoring tools.
Cons
- Need more tools to collect and store info.
- Be difficult to configure for large-scale environments.
- Enable advanced functionalities by paid tiers or plugins.
Zabbix
Networks and applications with IT infrastructure receive monitoring support through the Zabbix open-source solution. Zabbix delivers real-time monitoring, automatic alerting, and automation capabilities, which makes it a widely used solution for data centers and businesses.
Key Features
- Monitor network interfaces, devices, and traffic.
- Check server health, resource use, and performance.
- Watch virtual machines and hosts.
- Keep track of database health.
Pros
- Free and open-source.
- Complete infrastructure monitoring.
- Several support and neighborhood groups.
- Capable of monitoring enormous environments.
Cons
- Required technical competence for setup and configuration.
- Fewer application performance monitoring options than specialist APM tools.
- Required extra tools for advanced analytics and visualization.
>> Read more:
- Top 7 Web App Security Testing Tools For Developers
- Top 17 API Testing Tools for Software Testing Process
- Top 7 Best Performance Testing Tools for Developers
- Top 9 Modern Software Development Tools for Businesses
- Top 10 Automated Code Review Tools For Developers
Conclusion
Choosing the correct application monitoring solution is critical for businesses looking to optimize application performance, improve user experience, and reduce downtime. Remember that continual monitoring and optimization are critical for guaranteeing application health and company success in today's ever-changing digital landscape. Businesses that employ a strong application monitoring strategy can gain a competitive advantage, increase client loyalty, and drive overall growth.
>>> Follow and Contact Relia Software for more information!

- development