
In the fast-paced world of software development, where performance can make or break user experience, the concept of profiling emerges as a beacon of insight. Profiling, in essence, is akin to shining a spotlight into the inner workings of our code, revealing its strengths and weaknesses.
In this blog post, we embark on a journey into the realm of profiling, focusing particularly on its significance in optimizing the performance of Node.js applications. As Node.js continues to gain traction as a popular runtime environment for building fast and scalable applications, understanding how to identify and address performance bottlenecks becomes paramount. Let's explore Node.js profiler now!
>> Read more about Node.js:
- How to Install Node.js on Ubuntu 22.04?
- A Comprehensive Guide for Node.js Dependency Injection
- Mastering Node.js Event Loop to Write Efficient Async Code
- How to Dockerize A Node.js Application & Deploy it To EC2?
What is Profiling?
Profiling is a fundamental technique in software development used to analyze the performance characteristics of a program or system. It involves gathering data about the runtime behavior of the application, such as resource usage, execution time, and function calls, to identify performance bottlenecks and areas for optimization.
For Node.js applications, profiling takes on even greater significance. Node.js thrives on its event-driven, non-blocking architecture, making it adept at handling high concurrency. However, even the most efficient Node.js applications can succumb to performance bottlenecks.
Profiling empowers developers to pinpoint these bottlenecks, be it CPU-intensive computations or excessive function calls. Armed with this knowledge, developers can strategically target optimizations, ensuring their Node.js applications deliver exceptional performance and scalability.
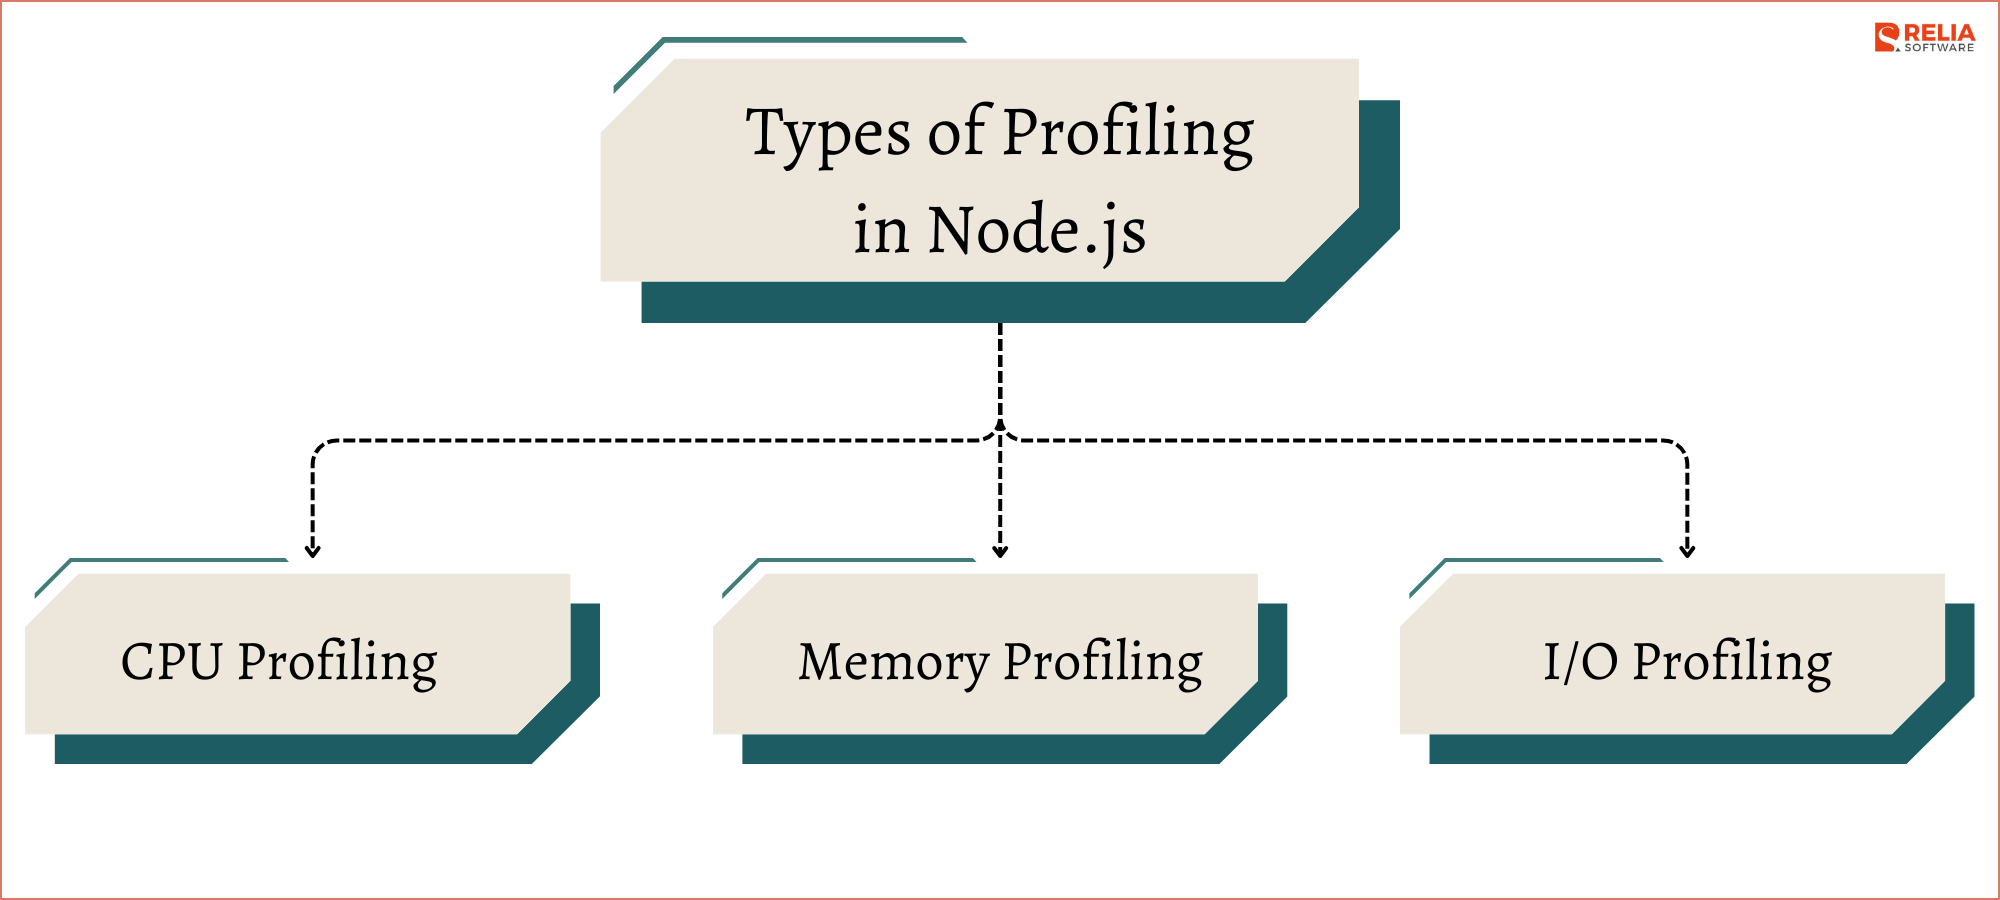
Types of Profiling in Node.js
In the context of Node.js applications, three primary types of profiling shine a light on different aspects:
CPU Profiling
CPU profiling involves measuring the amount of time spent executing different functions or sections of code by the CPU. It helps identify CPU-bound operations and hotspots where the application spends most of its processing time.
Memory Profiling
Memory profiling focuses on monitoring the memory usage and allocation patterns of an application. It helps detect memory leaks, excessive memory consumption, and inefficient memory management practices, which can lead to degraded performance and stability issues.
I/O Profiling
I/O profiling examines the input/output operations performed by an application, such as file system access, network requests, and database queries. It helps pinpoint I/O-bound operations and bottlenecks that impact the application's responsiveness and throughput.
Benefits of Profiling
- Identifying Performance Bottlenecks: Profiling helps pinpoint areas of the code that contribute most to performance degradation, allowing developers to prioritize optimization efforts.
- Optimizing Resource Usage: By analyzing resource utilization data, profiling enables developers to optimize CPU, memory, and I/O usage, leading to improved efficiency and reduced resource consumption.
- Improving Scalability: Profiling helps identify scalability bottlenecks that limit the application's ability to handle increased load. By addressing these bottlenecks, developers can improve the application's scalability and ability to scale with growing user demand.
- Enhancing User Experience: Optimizing the performance of an application through profiling results in faster response times, reduced latency, and smoother user experiences, ultimately leading to higher user satisfaction and engagement.
Popular Node.js Profilers
The choice of profiling tool for Node.js applications depends on factors such as ease of use, required features, and performance impact. Developers should consider their specific profiling needs and preferences when selecting a profiling tool for analyzing the performance of their Node.js applications.
Let's explore some popular profiling tools for Node.js and compare their features, pros, and cons:
Node.js Built-in Profiler (v8-profiler)
The v8-profiler is a built-in profiler in Node.js that provides CPU profiling capabilities. It allows developers to capture CPU profiles of Node.js applications and analyze the execution time of functions and scripts.
Pros:
- Easy to use with basic commands for capturing and analyzing snapshots, perfect for beginners.
- No additional installation required as it's included with Node.js.
- Provides detailed CPU profiling data, including function execution times and call stacks.
Cons:
- Focuses solely on CPU profiling and lacks other profiling capabilities like memory and I/O profiling.
- Profiling overhead can impact application performance.
Chrome DevTools
Chrome DevTools is a comprehensive set of web development tools included in the Google Chrome browser. It includes performance profiling features for analyzing JavaScript code execution, memory usage, and network activity.
Pros:
- Offers a user-friendly interface with real-time performance metrics visualization.
- Supports CPU profiling, memory profiling, and network profiling for Node.js applications running in Chrome.
Cons:
- Requires running Node.js with the
-inspectflag and using the Chrome browser for profiling. - May not be as powerful as standalone profiling tools for advanced analysis.
Best Practices for Node.js Profiling
Profiling Node.js applications is essential for optimizing performance and identifying areas for improvement. Here are some best practices to ensure effective profiling:
Regular Profiling as Part of the Development Process
- Schedule Regular Profiling Sessions: Make profiling a routine part of your development process. Regularly profile your application during development, testing, and production to identify performance regressions and monitor improvements over time.
- Automate Profiling Tasks: Integrate profiling into your continuous integration (CI) pipeline to automate profiling tasks. Use tools like CLI commands or scripts to run profiling tests automatically whenever code changes are pushed.
Focusing on Critical Paths and Hotspots
- Identify Critical Paths: Prioritize profiling efforts by identifying critical paths and hotspots in your application. Focus on areas of the code that contribute most to overall execution time or resource consumption.
- Target Resource-Intensive Operations: Profile functions, modules, or components that are CPU-intensive, memory-intensive, or I/O-bound. Analyze their performance to uncover optimization opportunities and bottlenecks.
Using Multiple Profiling Tools for Comprehensive Analysis
- Diversify Profiling Tools: Use a combination of profiling tools to gain a comprehensive understanding of your application's performance. Combine CPU profiling, memory profiling, and I/O profiling tools to capture different aspects of runtime behavior.
- Compare Results: Compare profiling results from different tools to validate findings and identify discrepancies. Each profiling tool may offer unique insights and perspectives, enhancing the accuracy of your analysis.
Interpreting Profiling Results in Context
- Consider Application Architecture: Interpret profiling results in the context of your application's architecture and design. Understand how different components interact and impact overall performance.
- Align with Business Requirements: Prioritize optimization efforts based on business requirements and user expectations. Focus on areas of the application that directly impact user experience, revenue generation, or operational efficiency.
Continuous Monitoring and Iterative Optimization
- Monitor Performance Metrics: Implement continuous monitoring of performance metrics in production environments. Use application monitoring tools to track key performance indicators (KPIs) and detect anomalies or performance degradation.
- Iterative Optimization: Treat performance optimization as an iterative process. Continuously analyze profiling data, implement optimizations, and measure their impact on performance. Iterate based on feedback and evolving requirements to achieve ongoing improvements.
>> You may consider:
- Top 15 Node.js Projects for Beginners and Professionals
- Top 9 Best Node.js Frameworks For Web App Development
Conclusion
By leveraging profiling tools to identify and address performance bottlenecks, improve scalability and reliability, and enhance user experience, organizations can unlock the full potential of their Node.js applications and stay ahead in today's competitive landscape. Profiling isn't just a technical exercise; it's a strategic investment that drives business success by delivering superior software solutions to end-users.
>>> Follow and Contact Relia Software for more information!

- coding
- development
- Mobile App Development