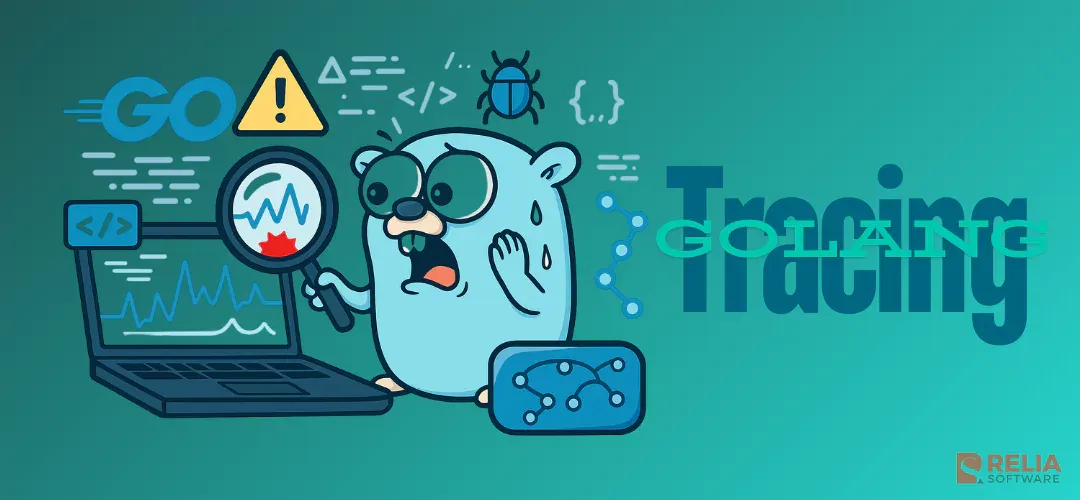
Debugging is essential to software development, helping developers uncover issues in complex code. As applications grow, finding performance bottlenecks and elusive bugs becomes more challenging. For Go developers, using the right tools can simplify this process.
Go tracing, a built-in feature of Go, is a powerful tool for performance debugging. When paired with OpenTelemetry, an open-source observability framework, it enhances debugging by providing comprehensive visibility into distributed systems.
This guide will show you how to implement Go tracing with OpenTelemetry to improve your debugging process, making it more efficient and effective.
>> Read more: Mastering 6 Golang Concurrency Patterns to Level Up Your Apps
What is Go Tracing?
Go tracing is a feature in the Go programming language that provides detailed insights into the execution of a program. It records a timeline of key events, such as function calls, goroutine creation, and network operations, allowing developers to see the sequence of operations and the time spent on each task.
Unlike basic Golang logging or profiling, Go tracing offers a more granular view of your code's execution, making it especially useful for diagnosing performance issues and concurrency-related bugs.
How Go Tracing Differs from Other Debugging Tools?
- Logging: Logging tools capture specific messages or data points during code execution, useful for tracking flow and errors. However, logging provides a limited view of performance issues and can become overwhelming in complex applications, making it hard to locate the root cause of problems.
- Profiling: Profiling tools, like
pprof, measure resource usage (CPU, memory, etc.) to identify hotspots. While profiling highlights resource consumption, it lacks detailed information about execution flow and concurrency, which are vital for diagnosing performance bottlenecks, especially in distributed systems.
Go tracing distinguishes itself by offering a comprehensive view of the execution process, capturing both the timing and sequence of events. This makes it particularly useful for analyzing interactions between goroutines, identifying race conditions, and optimizing performance in high-concurrency environments.
>> Read more: A Complete Guide to Identify and Prevent Golang Memory Leaks
When to Use Go Tracing?
- Diagnosing Concurrency Issues: Go tracing is invaluable in scenarios with heavy goroutine usage. It helps identify deadlocks, race conditions, and other concurrency issues by revealing the precise sequence of events and interactions between goroutines.
- Identifying Performance Bottlenecks: If your application is slowing down, Go tracing can pinpoint the functions or operations causing delays. By analyzing traces, you can determine which parts of your code are consuming the most time and optimize accordingly.
- Tracking Network and I/O Operations: In applications involving significant network communication or I/O operations, Go tracing provides visibility into how these operations are handled and where potential delays are occurring.
- Monitoring Distributed Systems: In distributed Go applications, tracing is essential for understanding how requests flow through the system. It helps track requests across services, identify latency issues, and ensure that all components are functioning as expected.
Incorporating Go tracing into your debugging process allows you to gain deeper insights into your application's behavior, leading to more efficient and effective problem-solving.
Setting Up Go Tracing
Enabling Tracing in Your Go Application
To enable tracing in a Go application, you'll need to import the necessary packages and set up tracing logic within your code. The Go standard library provides the runtime/trace package, which offers tools for starting, stopping, and managing tracing.
Here's a simple way to enable tracing in your Go application:
- Import the Required Packages: You'll need the
runtime/trace,os, andlogpackages for tracing, file handling, and logging.
package main

import (
    "log"
    "os"
    "runtime/trace"
)- Start Tracing: Open a file to store the trace data and initiate tracing with
trace.Start().
func main() {
    // Create a file to store the trace output
    f, err := os.Create("trace.out")
    if err != nil {
        log.Fatalf("failed to create trace output file: %v", err)
    }
    defer f.Close()

    // Start the trace
    if err := trace.Start(f); err != nil {
        log.Fatalf("failed to start trace: %v", err)
    }
    defer trace.Stop()

    // Your application code here
    exampleFunction()
}

func exampleFunction() {
    // Simulate some work
    for i := 0; i < 100; i++ {
        // Do something
    }
}- Stop Tracing: It’s important to stop the trace once you’ve completed the operations you want to trace. This is done using
trace.Stop(), which is typically deferred to ensure it runs when the main function exits. - Running the Application: Compile and run your Go application as usual. The trace output will be saved to the
trace.outfile.
Basic Setup Example with Code Snippets
Here’s a more complete example that demonstrates how to enable and use Go tracing in a basic Go application:
package main

import (
    "log"
    "os"
    "runtime/trace"
)

func main() {
    // Create a file to store the trace output
    f, err := os.Create("trace.out")
    if err != nil {
        log.Fatalf("failed to create trace output file: %v", err)
    }
    defer f.Close()

    // Start the trace
    if err := trace.Start(f); err != nil {
        log.Fatalf("failed to start trace: %v", err)
    }
    defer trace.Stop()

    // Simulate application logic
    computeFibonacci(10)
}

func computeFibonacci(n int) int {
    if n <= 1 {
        return n
    }
    return computeFibonacci(n-1) + computeFibonacci(n-2)
}
In this example:
trace.Start()begins capturing trace data, which is written totrace.out.- The
computeFibonacci()function simulates a workload, which you can analyze in the trace data. - Tracing stops when the main function exits, ensuring all data is saved to the file.
Analyzing the Trace Output
To analyze the trace, use the go tool trace command:
go tool trace trace.outThis command launches a web interface where you can explore various aspects of the trace, including goroutine execution timelines and network events. This visual analysis helps identify issues and optimize performance.
By following these steps, you can efficiently set up Go tracing in your applications, establishing a solid foundation for advanced debugging and performance analysis.
Generation to Analysis
This section will guide you through the complete process of working with Go tracing, from generating and collecting trace data to analyzing and applying best practices. By understanding this process, you can leverage Go tracing to optimize your application's performance.
Generating and Collecting Trace Data
To start utilizing Go tracing, you first need to generate trace data within your application:
- Generating Trace Data: Use the
runtime/tracepackage to implement tracing around specific code sections you want to analyze, such as key functions or operations. - Common Scenarios for Trace Data Generation:
- Web Servers: Trace HTTP request handling to detect latency issues.
- Background Jobs: Monitor long-running tasks for efficiency.
- Goroutines: Trace concurrent execution to diagnose issues like race conditions or deadlocks.
Then, collecting and storing trace data: After generating trace data, save it to a file for analysis. Centralized storage or using an observability platform can help manage and access trace data efficiently.
Analyzing Trace Data
Once you've collected trace data, the next step is to analyze it:
- Tools for Analyzing Go Trace Data: The
go tool tracecommand is your primary tool for visualizing and interpreting the trace output. It offers a detailed view of your application's execution, helping you identify performance bottlenecks. - Guide to
go tool trace: Learn how to load and analyze trace data, explore timelines, and interpret common trace patterns such as goroutine scheduling and network delays. Understanding these patterns will help you optimize your application's performance.
Best Practices for Effective Go Tracing
To make the most of Go tracing without adding unnecessary overhead:
- Choosing the Right Tool: Recognize when tracing is the best approach compared to other debugging tools like logging or profiling. Tracing is ideal for detailed performance and concurrency analysis.
- Minimizing Performance Overhead: Use selective tracing, reduce trace duration, and implement sampling to limit the performance impact while still gathering valuable insights.
- Integrating Tracing into CI/CD: Incorporate tracing into your CI/CD pipeline for continuous performance monitoring. Automating trace collection during testing allows you to analyze results and track performance trends over time. Integrating with tools like OpenTelemetry can further enhance your tracing efforts.
A Complete Example: Generating, Collecting, and Analyzing Trace Data
Below is an example that demonstrates the complete process of generating, collecting, and analyzing trace data using Go's runtime/trace package. This example also includes how to integrate tracing into typical scenarios like an HTTP server and background tasks.
package main

import (
    "log"
    "net/http"
    "os"
    "runtime/trace"
    "sync"
    "time"
)

func main() {
    // Step 1: Create a file to store the trace output
    f, err := os.Create("trace.out")
    if err != nil {
        log.Fatalf("failed to create trace output file: %v", err)
    }
    defer f.Close()

    // Step 2: Start tracing
    if err := trace.Start(f); err != nil {
        log.Fatalf("failed to start trace: %v", err)
    }
    defer trace.Stop()

    // Step 3: Run an HTTP server and a background job concurrently
    var wg sync.WaitGroup
    wg.Add(2)

    // HTTP Server
    go func() {
        defer wg.Done()
        runHTTPServer()
    }()

    // Background Job
    go func() {
        defer wg.Done()
        runBackgroundJob()
    }()

    // Wait for both to finish
    wg.Wait()
}

// Example HTTP server to trace incoming requests
func runHTTPServer() {
    http.HandleFunc("/", func(w http.ResponseWriter, r *http.Request) {
        log.Println("Handling HTTP request")
        // Simulate some processing
        time.Sleep(100 * time.Millisecond)
        w.Write([]byte("Hello, world!"))
    })

    log.Println("Starting HTTP server on :8080")
    if err := http.ListenAndServe(":8080", nil); err != nil {
        log.Fatalf("HTTP server failed: %v", err)
    }
}

// Example background job to trace long-running tasks
func runBackgroundJob() {
    log.Println("Starting background job")
    // Simulate a long-running task
    time.Sleep(2 * time.Second)
    log.Println("Background job completed")
}- Creating a Trace File: The example starts by creating a file named
trace.out, where the trace data will be stored. - Starting and Stopping Tracing: Tracing is started with
trace.Start(f)and stopped withtrace.Stop()at the end of themainfunction. Thedeferstatements ensure that tracing stops even if an error occurs. - HTTP Server: The code includes an HTTP server that listens on port 8080. Each incoming request is logged and processed with a simulated delay using
time.Sleep. This part of the code is traced to help identify latency issues in request handling. - Background Job: In parallel with the HTTP server, a background job is run, simulating a long-running task with a 2-second delay. This is traced to monitor and analyze the job's execution time.
- Concurrency: The
sync.WaitGroupis used to manage the concurrency between the HTTP server and the background job, ensuring that both run to completion before the program exits
Running and Analyzing the Trace
- Run the Application:
go run main.go- Analyze the Trace Data:
After running the program, a trace.out file will be created. Use the Go tool to analyze the trace:
go tool trace trace.outThis command opens a web-based interface where you can view the trace data, including goroutine execution, network events, and more
What to Look For in the Trace?
- HTTP Requests: Analyze the timeline to see how HTTP requests are processed, the time taken for each request, and any potential bottlenecks.
- Background Job: Check the execution of the background tasks, looking for any unexpected delays or concurrency issues.
- Goroutines: Inspect the behavior of goroutines, including their creation, scheduling, and execution, to ensure efficient concurrency handling.
This example provides a hands-on approach to mastering Go tracing, helping you understand how to implement and analyze trace data for better debugging and performance optimization in your Go applications.
Conclusion
In this blog, we've delved into the powerful capabilities of Go tracing for gaining deep insights into your application's performance and behavior. From generating and collecting trace data to analyzing it and applying best practices, you've learned how to effectively use tracing to diagnose performance bottlenecks and concurrency issues.
By tracing selectively and managing overhead, you can optimize your applications without compromising performance. I encourage you to experiment with Go tracing in your Golang projects to enhance your debugging skills and build more efficient applications. For further learning, explore the Go runtime/trace package and OpenTelemetry for Go. Happy tracing!
>>> Follow and Contact Relia Software for more information!

- golang
- development